Mini
2013 Mini Cooper. Property of Lordopher. Added Jan 31 2018
2013
|
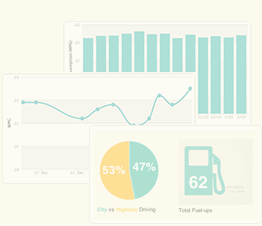
Total Fuel-ups
40
|
Avg Miles/Fuel-Up
304.9
|
Avg Price/Gallons
$4.12
|
|
Total Miles Tracked
12,195
|
Total Gallons Fueled
453.42
|
Avg Price/Fuel-up
$46.65
|
|
Total Spent
$1,865.92
|
Avg Price/Mile
$0.15
|
Avg MPG
26.9
|
2014
|
Total Fuel-ups
40
|
Avg Miles/Fuel-Up
300.0
|
Avg Price/Gallons
$4.04
|
|
Total Miles Tracked
11,998
|
Total Gallons Fueled
450.92
|
Avg Price/Fuel-up
$45.45
|
|
Total Spent
$1,818.10
|
Avg Price/Mile
$0.15
|
Avg MPG
26.6
|
2015
|
Total Fuel-ups
46
|
Avg Miles/Fuel-Up
295.3
|
Avg Price/Gallons
$3.52
|
|
Total Miles Tracked
12,993
|
Total Gallons Fueled
478.08
|
Avg Price/Fuel-up
$37.32
|
|
Total Spent
$1,716.75
|
Avg Price/Mile
$0.13
|
Avg MPG
27.2
|
2016
|
Total Fuel-ups
36
|
Avg Miles/Fuel-Up
282.5
|
Avg Price/Gallons
$3.23
|
|
Total Miles Tracked
9,886
|
Total Gallons Fueled
384.31
|
Avg Price/Fuel-up
$34.56
|
|
Total Spent
$1,244.25
|
Avg Price/Mile
$0.13
|
Avg MPG
25.7
|
2017
|
Total Fuel-ups
24
|
Avg Miles/Fuel-Up
249.1
|
Avg Price/Gallons
$3.51
|
|
Total Miles Tracked
5,979
|
Total Gallons Fueled
275.24
|
Avg Price/Fuel-up
$40.06
|
|
Total Spent
$961.41
|
Avg Price/Mile
$0.16
|
Avg MPG
21.7
|
2018
|
Total Fuel-ups
23
|
Avg Miles/Fuel-Up
249.3
|
Avg Price/Gallons
$4.02
|
|
Total Miles Tracked
5,733
|
Total Gallons Fueled
270.98
|
Avg Price/Fuel-up
$47.32
|
|
Total Spent
$1,088.27
|
Avg Price/Mile
$0.19
|
Avg MPG
21.2
|
2019
|
Total Fuel-ups
20
|
Avg Miles/Fuel-Up
234.8
|
Avg Price/Gallons
$4.20
|
|
Total Miles Tracked
4,461
|
Total Gallons Fueled
225.44
|
Avg Price/Fuel-up
$49.70
|
|
Total Spent
$993.93
|
Avg Price/Mile
$0.21
|
Avg MPG
19.8
|
2020
|
Total Fuel-ups
8
|
Avg Miles/Fuel-Up
250.1
|
Avg Price/Gallons
$3.91
|
|
Total Miles Tracked
2,001
|
Total Gallons Fueled
88.03
|
Avg Price/Fuel-up
$43.16
|
|
Total Spent
$345.27
|
Avg Price/Mile
$0.17
|
Avg MPG
22.7
|