Tacoma
2016 Toyota Tundra. Property of NetMonkey. Added Sep 14 2009
2009
|
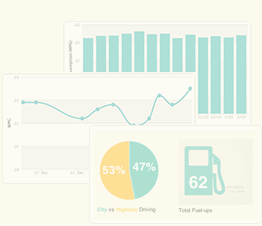
Total Fuel-ups
11
|
Avg Miles/Fuel-Up
245.7
|
Avg Price/Gallons
$3.19
|
|
Total Miles Tracked
2,702
|
Total Gallons Fueled
160.96
|
Avg Price/Fuel-up
$46.30
|
|
Total Spent
$509.26
|
Avg Price/Mile
$0.19
|
Avg MPG
16.8
|
2010
|
Total Fuel-ups
43
|
Avg Miles/Fuel-Up
279.9
|
Avg Price/Gallons
$2.88
|
|
Total Miles Tracked
12,038
|
Total Gallons Fueled
697.62
|
Avg Price/Fuel-up
$46.56
|
|
Total Spent
$2,001.92
|
Avg Price/Mile
$0.17
|
Avg MPG
17.3
|
2011
|
Total Fuel-ups
26
|
Avg Miles/Fuel-Up
271.5
|
Avg Price/Gallons
$3.33
|
|
Total Miles Tracked
7,058
|
Total Gallons Fueled
439.97
|
Avg Price/Fuel-up
$56.20
|
|
Total Spent
$1,461.18
|
Avg Price/Mile
$0.21
|
Avg MPG
16.0
|
2012
|
Total Fuel-ups
55
|
Avg Miles/Fuel-Up
262.9
|
Avg Price/Gallons
$3.53
|
|
Total Miles Tracked
14,461
|
Total Gallons Fueled
865.93
|
Avg Price/Fuel-up
$55.21
|
|
Total Spent
$3,036.78
|
Avg Price/Mile
$0.21
|
Avg MPG
16.7
|
2013
|
Total Fuel-ups
33
|
Avg Miles/Fuel-Up
319.0
|
Avg Price/Gallons
$3.30
|
|
Total Miles Tracked
10,528
|
Total Gallons Fueled
594.05
|
Avg Price/Fuel-up
$59.42
|
|
Total Spent
$1,961.02
|
Avg Price/Mile
$0.19
|
Avg MPG
17.7
|
2014
|
Total Fuel-ups
49
|
Avg Miles/Fuel-Up
237.3
|
Avg Price/Gallons
$3.20
|
|
Total Miles Tracked
11,628
|
Total Gallons Fueled
754.05
|
Avg Price/Fuel-up
$48.58
|
|
Total Spent
$2,380.27
|
Avg Price/Mile
$0.20
|
Avg MPG
15.4
|
2015
|
Total Fuel-ups
29
|
Avg Miles/Fuel-Up
300.3
|
Avg Price/Gallons
$2.03
|
|
Total Miles Tracked
8,709
|
Total Gallons Fueled
521.04
|
Avg Price/Fuel-up
$36.55
|
|
Total Spent
$1,060.02
|
Avg Price/Mile
$0.12
|
Avg MPG
16.7
|
2016
|
Total Fuel-ups
8
|
Avg Miles/Fuel-Up
288.8
|
Avg Price/Gallons
$1.53
|
|
Total Miles Tracked
2,310
|
Total Gallons Fueled
139.90
|
Avg Price/Fuel-up
$27.13
|
|
Total Spent
$217.01
|
Avg Price/Mile
$0.09
|
Avg MPG
16.5
|