2016 ToyotaTundra
2016 Toyota Tundra. Property of QE500. Added Jul 27 2018
2018
|
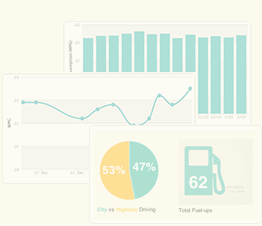
Total Fuel-ups
13
|
Avg Miles/Fuel-Up
651.1
|
Avg Price/Gallons
$3.49
|
|
Total Miles Tracked
7,162
|
Total Gallons Fueled
307.50
|
Avg Price/Fuel-up
$88.60
|
|
Total Spent
$1,151.80
|
Avg Price/Mile
$0.14
|
Avg MPG
23.3
|
2019
|
Total Fuel-ups
52
|
Avg Miles/Fuel-Up
514.3
|
Avg Price/Gallons
$2.95
|
|
Total Miles Tracked
26,744
|
Total Gallons Fueled
1,331.09
|
Avg Price/Fuel-up
$66.00
|
|
Total Spent
$3,563.74
|
Avg Price/Mile
$0.13
|
Avg MPG
20.1
|
2020
|
Total Fuel-ups
47
|
Avg Miles/Fuel-Up
458.1
|
Avg Price/Gallons
$2.74
|
|
Total Miles Tracked
21,072
|
Total Gallons Fueled
1,229.53
|
Avg Price/Fuel-up
$68.92
|
|
Total Spent
$3,445.95
|
Avg Price/Mile
$0.16
|
Avg MPG
17.1
|
2021
|
Total Fuel-ups
28
|
Avg Miles/Fuel-Up
795.0
|
Avg Price/Gallons
$2.99
|
|
Total Miles Tracked
20,669
|
Total Gallons Fueled
672.00
|
Avg Price/Fuel-up
$74.76
|
|
Total Spent
$2,168.00
|
Avg Price/Mile
$0.10
|
Avg MPG
30.8
|
2022
|
Total Fuel-ups
60
|
Avg Miles/Fuel-Up
397.5
|
Avg Price/Gallons
$4.75
|
|
Total Miles Tracked
23,849
|
Total Gallons Fueled
1,477.54
|
Avg Price/Fuel-up
$114.23
|
|
Total Spent
$6,967.87
|
Avg Price/Mile
$0.29
|
Avg MPG
16.1
|
2023
|
Total Fuel-ups
46
|
Avg Miles/Fuel-Up
484.5
|
Avg Price/Gallons
$4.24
|
|
Total Miles Tracked
19,865
|
Total Gallons Fueled
1,071.40
|
Avg Price/Fuel-up
$107.15
|
|
Total Spent
$5,035.88
|
Avg Price/Mile
$0.23
|
Avg MPG
18.5
|
2024
|
Total Fuel-ups
11
|
Avg Miles/Fuel-Up
649.5
|
Avg Price/Gallons
$3.64
|
|
Total Miles Tracked
7,145
|
Total Gallons Fueled
270.00
|
Avg Price/Fuel-up
$89.84
|
|
Total Spent
$988.23
|
Avg Price/Mile
$0.14
|
Avg MPG
26.5
|